



kimhutton.
+159%
month-on-monthFPD uplift
26
brands analysed
66
criteria data maturity index
Data maturity isn't what you collect. It's what it's worth.
Client: Heineken BeveragesRole: Senior Digital Insights Manager, Centre of IntelligenceScope: 26-brand portfolio · South AfricaFocus: First-party data · CRM · lead generation · UX optimisation · measurement frameworks · portfolio-wide brand recommendations
Setting the scene
The brief asked for a phased first-party data maturity approach across a 26-brand portfolio.
I was embedded within Heineken Beverages as Senior Insights Manager at Ripple — a Center of Intelligence built inside the client organisation by Hoorah Group.
It wasn't a traditional agency relationship. I had direct access to brand data and dashboards — the data intimacy of an insider, and the diagnostic independence of an external consultant.
The Observation
As I worked through the data and analysed past FPD collection campaigns from all the brands, I realised that all of the brands were effectively buying the software suite and using one feature — yet they were all mandated to allocate some of their marketing budget to FPD collection and maturity.
Strategic Reframe
FROM How do we collect more data?
To
Do the brands know how to make the data worth collecting, worth giving, and worth using afterwards?
Approach
Key insights
Three sequential phases — each the necessary precondition for the next.PHASE ONE: A shared maturity roadmap. Aim: establish a shared definition of what maturity looks like and answer the initial brief.Across the portfolio, brands were investing significant time and budget in FPD collection activity — yet the data pointed to a behaviour and value-exchange problem, not a volume problem. Online engagement was high. These were some of the most loved brands in South Africa. But first-party data numbers were dismal.
Users would relentlessly engage with UGC, then drop off or fail to complete profile submissions in the same campaign window.
Data was being collected, but not consistently cleaned, enriched, tracked against effort, or evaluated against the final outcome that mattered: full, usable, contactable consumer profiles.
The DiagnosticThe real problem was not insufficient collection activity. It was insufficient diagnostic infrastructure to evaluate what that activity was producing.
WORKSHOP ONE:The Shared Maturity Roadmap addressed the initial brief directly. It gave brand teams what they needed to understand: what first-party data maturity actually meant — what consumer barriers existed at each stage, what tools were available, what data could be collected, and how each stage of maturity could shape better strategy downstream.
But in developing it, a second gap became impossible to ignore. Brand teams now had a roadmap — but no instrument to tell them where they currently sat on it.
That gap opened the door to Phase Two. The brief was expanded, and my work began.
PHASE TWO: The Data Maturity IndexAim: Build the measurement instrument.
Context
I knew from the first phase of this approach that just about every brand was going to be scrutinised for disproportionate spend vs return. I had built direct relationships with senior marketing leadership and brand managers — and as some of the most loved brands in SA, the egos were high. Certain teams were getting a bit defensive. So, I had to ensure that the framework was entirely objective, factual and based on the metrics we had.
When I went to pull the data, First Party Data activity wasn't being tracked within one system.
It was clear that brands were collecting data, spending budget, running mechanics and reporting numbers — but there was no shared way to see whether any of it was actually creating usable commercial value. It became clear that many brands could not confidently answer the question underneath all of it:
"How much effort are we putting in, and what usable value are we getting back?"That was the strategic unlock.
Building the Data Maturity Index
I developed a survey for teams to circulate and fill in the numbers and yes/no answers. The questions, their yes/no answers and provided metrics were all weighted according to the Data Maturity Index, giving each brand a 'Data Maturity Score'.
The structural logic: 66 criteria connecting the full acquisition journey — campaign mechanics, paid media, social CTAs, form design, consent clarity, behavioural-data questions, CRM usefulness, and future marketing value.
The weighting logic: the greater the complexity and strategic knowledge required by a tactic, the greater the score it contributes.
How this answers Heineken’s initial brief: if it rewards activity, brands will generate activity. If it rewards sophistication, brands will invest in capability. A principle about incentive design embedded in a measurement tool. This wasn't about measuring what was easy to count — it was one that measures what matters commercially.
What The Results Revealed
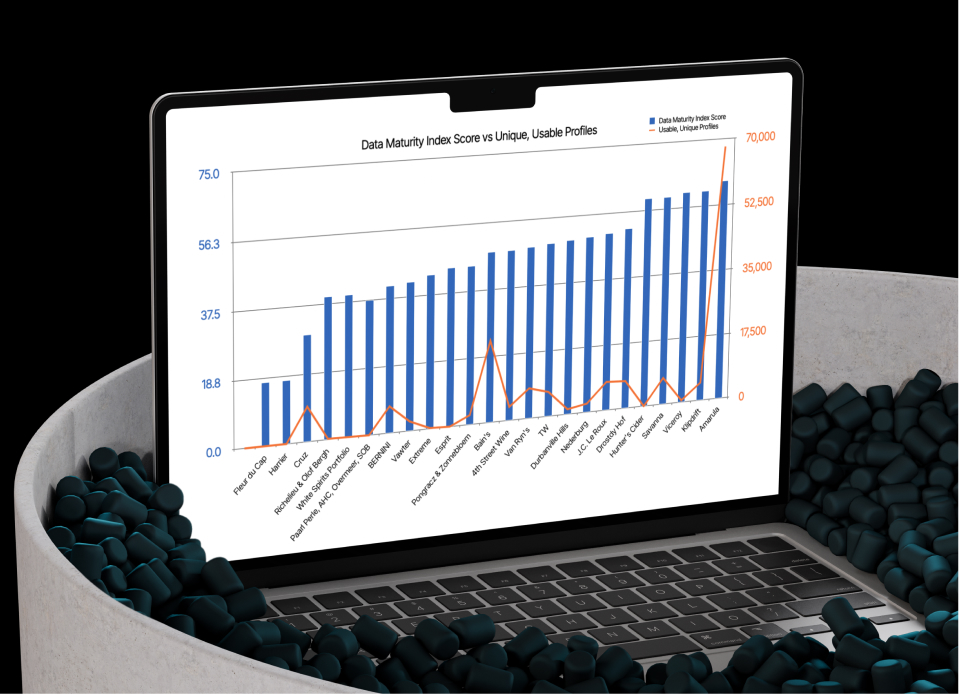
Once I had the DMI scores and unique profiles for each brand, I developed a combination graph to showcase DMI score (effort) and unique profiles (result), to visualise the inefficiency gap. I knew that the data needed a specific lens to become legible. This graph made the gap between what a brand is investing and what it is getting back immediately, indefensibly visible.
AMARULA67,900DMI Score: 61
3.88% budget attribution · High output. Low proportional investment.
SAVANNA7,100DMI Score: 59.5
20.91% budget attribution · Five times the investment. One-ninth of the output.
Savanna had the largest budget allocation toward FPD collection, and one of the highest DMI scores in the portfolio. However, the amount of usable, unique profiles they had compared to their DMI and budget allocation were dismal. I was not saying their campaigns performed poorly — I was saying they had a structural misallocation between investment and return.
Amarula, on the other hand, only had a 3.88% budget allocation to FPD and had not done any advanced FPD collection campaigns such as gamification. Yet they produced 67,900 unique, usable profiles — the highest in the portfolio, at less than a fifth of Savanna's proportional budget investment.
So, Savanna was putting in five times the proportional investment into First Party Data acquisition as Amarula, and getting roughly one-ninth of the profile output.
The individual roadmaps
From each brand's diagnostic position, I developed prescriptive, bounded, operationally credible recommendations and individual strategic roadmaps — specific, prioritised initiative sets showing which FPD tactics to implement next and what maturity score improvement each would drive. I wasn't asking brands to transform their strategy. I was showing them what was achievable within the resources they already had.
Brands with very simple data acquisition tactics were given initiatives they could still comfortably execute, and as they progressed, the sophistication became more complex — so that teams didn't feel overwhelmed or out of their depth. Essentially, brand-to-brand consultation on where they were in their data maturity journey, what they were doing wrong, how to fix it, and what to do next.
Solving this within existing 1PD budgets
Online engagement was high. These were some of the most loved brands in South Africa. But first-party data numbers were dismal.
Users would relentlessly engage with UGC, then drop off or fail to complete profile submissions in the same campaign window.There was sufficient evidence to suggest that this was a behaviour and value-exchange problem — one that could be solved within existing FPD budgets. An understanding of human-computer interaction sharpened how I read the problem. The solution was not more collection activity. It was designing for reciprocity: determining what the value exchange actually is for each brand and their consumers, ensuring data collection gets adequate return on mandated spend without doing more or spending more. But the teams didn't know how to get there, nor how to design for it. During Phase 1, I had identified a gap: marketing teams had no idea how to design for effective FPD acquisition touchpoints. Forms were losing completions. Off-platform redirects were creating drop-off at the critical conversion moment.
The question was not how to collect more data. It was how to design collection so that consumers wanted to give it.
PHASE THREE: Post-Campaign Analysis Reports Aim: provide evidence that closed the loop on the diagnostic claims made in Phase 2.
The analysis was designed to validate the guide, not just report on the campaigns. I was testing the hypothesis that specific architectural decisions — native form over redirect, targeting discipline, consent integration — drive commercially significant differences in FPD acquisition performance. My hypothesis was correct.
The three campaigns — Amarula, Bains, Klipdrift — together tested the variables the framework had identified as commercially significant:
Native vs off-platform acquisition (Bains vs Klipdrift)
The impact of targeting discipline (Amarula)
What happens when UX principles are ignored (Klipdrift)
The Analytical Framework
Each dimension was chosen because it corresponded to a variable that the UX guide had identified as commercially significant.
I designed a single analytical framework — four standardised dimensions: approach, form, posts, media — and applied it consistently across all three campaigns. By having this single framework, I could read the results side by side, isolate the variables that differ between campaigns, and attribute performance differentials to specific decisions rather than brand-level factors like size or budget.
What the Analysis Proved
Klipdrift isolates exactly what happens when the principles the UX guide recommended are ignored. Compare this directly to Bains:
KLIPDRIFT1,928CPL R34.59
Total Spend: R66,694· No targeting strategy · off-platform redirect · unclear prize structure · high barrier to entry, unnecessary entry effort
BAINS21,543R3.92 CPL
Total spend: R91,999· Native Facebook instant form · granular psychographic targeting · four-stage data collection with consent integrated into the flow
If it had achieved Bains-level CPL efficiency (R3.92), that same budget would have generated approximately 17,014 leads — nearly nine times what it actually produced.
My strategic hypothesis from phase 1 was confirmed: better UX produced better data, not just more data.
Why Provenance Matters
All findings were derived from the portfolio's own data — the specific performance of specific campaigns run by brands in this portfolio with their audiences. Giving us rich, useful information on each brand’s audiences. Such as — what causes Amarula consumers to complete a form, what causes Klipdrift audiences to drop off, what made Bains achieve R3.92 CPL against Klipdrift's R34.59 — these are proprietary. And it directly informs the marketing and brand teams of what is working, and what is not, for their audience.
The value of integrating FPD tracking into campaigns
Amarula’s A/B test: one creative variant generated 1,855 leads; the other, 17,207. An 828% differential from a single variable change.
A specific finding about what motivates Amarula's audience when presented with a specific mechanic, at a specific moment, in a specific media context. Commercially durable in a way that general guidance never is — and generated at the cost of media spend already allocated to the programme.
Targeting
Granular psychographic targeting and lookalike audiences (based on this granular detail) was a recommendation in phase 2. Amarula and Bains both used this recommendation to varying degrees. Klipdrift used no targeting strategy.
Results
159% month-on-month uplift in first-party data capture across the portfolio — without extending spend.
Against a target of 200 leads at R15 CPL, the Amarula campaign I analysed and informed delivered 19,062 leads at R1.57 CPL — a 9,431% over-performance on volume. The strategic decisions that drove that result are a direct result of the frameworks and recommendations I built.
The A/B test I'd recommended produced an 828% difference between variants — proof that the methodology generates proprietary intelligence about what motivates a specific audience, not just a better-performing ad.
Unlocked a quarter of a million rand in expanded scope from the original brief within one week by earning the trust and buy-in from all brands within the portfolio.
Capability transfer
The work gave Heineken Beverages its first portfolio-wide way to compare acquisition effort against usable output, diagnose inefficiency, and turn campaign learnings into repeatable acquisition guidance.
The DMI didn't stay within this engagement. It became the dashboard logic for Heineken Beverages South Africa — and, as far as I know, is still being used today.
The work helped shift the Centre of Intelligence from a reporting function into a strategic advisory partner — and turned first-party data from a fragmented marketing activity into a measurable, behaviour-led growth system.
©2026 All Rights Reserved.

kimhutton.
+159%
month-on-monthFPD uplift
26
brands analysed
66
criteria data maturity index
Data maturity isn't what you collect. It's what it's worth.
Client: Heineken BeveragesRole: Senior Digital Insights Manager, Centre of IntelligenceScope: 26-brand portfolio · South AfricaFocus: First-party data · CRM · lead generation · UX optimisation · measurement frameworks · portfolio-wide brand recommendations
Setting the scene
The brief asked for a phased first-party data maturity approach across a 26-brand portfolio.
I was embedded within Heineken Beverages as Senior Insights Manager at Ripple — a Center of Intelligence built inside the client organisation by Hoorah Group.
It wasn't a traditional agency relationship. I had direct access to brand data and dashboards — the data intimacy of an insider, and the diagnostic independence of an external consultant.
The Observation
As I worked through the data and analysed past FPD collection campaigns from all the brands, I realised that all of the brands were effectively buying the software suite and using one feature — yet they were all mandated to allocate some of their marketing budget to FPD collection and maturity.
Strategic Reframe
FROM How do we collect more data?
To
Do the brands know how to make the data worth collecting, worth giving, and worth using afterwards?
Approach
Key insights
Three sequential phases — each the necessary precondition for the next.PHASE ONE: A shared maturity roadmap. Aim: establish a shared definition of what maturity looks like and answer the initial brief.Across the portfolio, brands were investing significant time and budget in FPD collection activity — yet the data pointed to a behaviour and value-exchange problem, not a volume problem. Online engagement was high. These were some of the most loved brands in South Africa. But first-party data numbers were dismal.
Users would relentlessly engage with UGC, then drop off or fail to complete profile submissions in the same campaign window.
Data was being collected, but not consistently cleaned, enriched, tracked against effort, or evaluated against the final outcome that mattered: full, usable, contactable consumer profiles.
The DiagnosticThe real problem was not insufficient collection activity. It was insufficient diagnostic infrastructure to evaluate what that activity was producing.
WORKSHOP ONE:The Shared Maturity Roadmap addressed the initial brief directly. It gave brand teams what they needed to understand: what first-party data maturity actually meant — what consumer barriers existed at each stage, what tools were available, what data could be collected, and how each stage of maturity could shape better strategy downstream.
But in developing it, a second gap became impossible to ignore. Brand teams now had a roadmap — but no instrument to tell them where they currently sat on it.
That gap opened the door to Phase Two. The brief was expanded, and my work began.
PHASE TWO: The Data Maturity IndexAim: Build the measurement instrument.
Context
I knew from the first phase of this approach that just about every brand was going to be scrutinised for disproportionate spend vs return. I had built direct relationships with senior marketing leadership and brand managers — and as some of the most loved brands in SA, the egos were high. Certain teams were getting a bit defensive. So, I had to ensure that the framework was entirely objective, factual and based on the metrics we had.
When I went to pull the data, First Party Data activity wasn't being tracked within one system.
It was clear that brands were collecting data, spending budget, running mechanics and reporting numbers — but there was no shared way to see whether any of it was actually creating usable commercial value. It became clear that many brands could not confidently answer the question underneath all of it:
"How much effort are we putting in, and what usable value are we getting back?"That was the strategic unlock.
Building the Data Maturity Index
I developed a survey for teams to circulate and fill in the numbers and yes/no answers. The questions, their yes/no answers and provided metrics were all weighted according to the Data Maturity Index, giving each brand a 'Data Maturity Score'.
The structural logic: 66 criteria connecting the full acquisition journey — campaign mechanics, paid media, social CTAs, form design, consent clarity, behavioural-data questions, CRM usefulness, and future marketing value.
The weighting logic: the greater the complexity and strategic knowledge required by a tactic, the greater the score it contributes.
How this answers Heineken’s initial brief: if it rewards activity, brands will generate activity. If it rewards sophistication, brands will invest in capability. A principle about incentive design embedded in a measurement tool. This wasn't about measuring what was easy to count — it was one that measures what matters commercially.
What The Results Revealed
Once I had the DMI scores and unique profiles for each brand, I developed a combination graph to showcase DMI score (effort) and unique profiles (result), to visualise the inefficiency gap. I knew that the data needed a specific lens to become legible. This graph made the gap between what a brand is investing and what it is getting back immediately, indefensibly visible.
AMARULA67,900DMI Score: 61
3.88% budget attribution · High output. Low proportional investment.
SAVANNA7,100DMI Score: 59.5
20.91% budget attribution · Five times the investment. One-ninth of the output.
Savanna had the largest budget allocation toward FPD collection, and one of the highest DMI scores in the portfolio. However, the amount of usable, unique profiles they had compared to their DMI and budget allocation were dismal. I was not saying their campaigns performed poorly — I was saying they had a structural misallocation between investment and return.
Amarula, on the other hand, only had a 3.88% budget allocation to FPD and had not done any advanced FPD collection campaigns such as gamification. Yet they produced 67,900 unique, usable profiles — the highest in the portfolio, at less than a fifth of Savanna's proportional budget investment.
So, Savanna was putting in five times the proportional investment into First Party Data acquisition as Amarula, and getting roughly one-ninth of the profile output.
The individual roadmaps
From each brand's diagnostic position, I developed prescriptive, bounded, operationally credible recommendations and individual strategic roadmaps — specific, prioritised initiative sets showing which FPD tactics to implement next and what maturity score improvement each would drive. I wasn't asking brands to transform their strategy. I was showing them what was achievable within the resources they already had.
Brands with very simple data acquisition tactics were given initiatives they could still comfortably execute, and as they progressed, the sophistication became more complex — so that teams didn't feel overwhelmed or out of their depth. Essentially, brand-to-brand consultation on where they were in their data maturity journey, what they were doing wrong, how to fix it, and what to do next.
Solving this within existing 1PD budgets
Online engagement was high. These were some of the most loved brands in South Africa. But first-party data numbers were dismal.
Users would relentlessly engage with UGC, then drop off or fail to complete profile submissions in the same campaign window.There was sufficient evidence to suggest that this was a behaviour and value-exchange problem — one that could be solved within existing FPD budgets. An understanding of human-computer interaction sharpened how I read the problem. The solution was not more collection activity. It was designing for reciprocity: determining what the value exchange actually is for each brand and their consumers, ensuring data collection gets adequate return on mandated spend without doing more or spending more. But the teams didn't know how to get there, nor how to design for it. During Phase 1, I had identified a gap: marketing teams had no idea how to design for effective FPD acquisition touchpoints. Forms were losing completions. Off-platform redirects were creating drop-off at the critical conversion moment.
The question was not how to collect more data. It was how to design collection so that consumers wanted to give it.
PHASE THREE: Post-Campaign Analysis Reports Aim: provide evidence that closed the loop on the diagnostic claims made in Phase 2.
The analysis was designed to validate the guide, not just report on the campaigns. I was testing the hypothesis that specific architectural decisions — native form over redirect, targeting discipline, consent integration — drive commercially significant differences in FPD acquisition performance. My hypothesis was correct.
The three campaigns — Amarula, Bains, Klipdrift — together tested the variables the framework had identified as commercially significant:
Native vs off-platform acquisition (Bains vs Klipdrift)
The impact of targeting discipline (Amarula)
What happens when UX principles are ignored (Klipdrift)
The Analytical Framework
Each dimension was chosen because it corresponded to a variable that the UX guide had identified as commercially significant.
I designed a single analytical framework — four standardised dimensions: approach, form, posts, media — and applied it consistently across all three campaigns. By having this single framework, I could read the results side by side, isolate the variables that differ between campaigns, and attribute performance differentials to specific decisions rather than brand-level factors like size or budget.
What the Analysis Proved
Klipdrift isolates exactly what happens when the principles the UX guide recommended are ignored. Compare this directly to Bains:
KLIPDRIFT1,928CPL R34.59
Total Spend: R66,694· No targeting strategy · off-platform redirect · unclear prize structure · high barrier to entry, unnecessary entry effort
BAINS21,543R3.92 CPL
Total spend: R91,999· Native Facebook instant form · granular psychographic targeting · four-stage data collection with consent integrated into the flow
If it had achieved Bains-level CPL efficiency (R3.92), that same budget would have generated approximately 17,014 leads — nearly nine times what it actually produced.
My strategic hypothesis from phase 1 was confirmed: better UX produced better data, not just more data.
Why Provenance Matters
All findings were derived from the portfolio's own data — the specific performance of specific campaigns run by brands in this portfolio with their audiences. Giving us rich, useful information on each brand’s audiences. Such as — what causes Amarula consumers to complete a form, what causes Klipdrift audiences to drop off, what made Bains achieve R3.92 CPL against Klipdrift's R34.59 — these are proprietary. And it directly informs the marketing and brand teams of what is working, and what is not, for their audience.
The value of integrating FPD tracking into campaigns
Amarula’s A/B test: one creative variant generated 1,855 leads; the other, 17,207. An 828% differential from a single variable change.
A specific finding about what motivates Amarula's audience when presented with a specific mechanic, at a specific moment, in a specific media context. Commercially durable in a way that general guidance never is — and generated at the cost of media spend already allocated to the programme.
Targeting
Granular psychographic targeting and lookalike audiences (based on this granular detail) was a recommendation in phase 2. Amarula and Bains both used this recommendation to varying degrees. Klipdrift used no targeting strategy.
Results
159% month-on-month uplift in first-party data capture across the portfolio — without extending spend.
Against a target of 200 leads at R15 CPL, the Amarula campaign I analysed and informed delivered 19,062 leads at R1.57 CPL — a 9,431% over-performance on volume. The strategic decisions that drove that result are a direct result of the frameworks and recommendations I built.
The A/B test I'd recommended produced an 828% difference between variants — proof that the methodology generates proprietary intelligence about what motivates a specific audience, not just a better-performing ad.
Unlocked a quarter of a million rand in expanded scope from the original brief within one week by earning the trust and buy-in from all brands within the portfolio.
Capability transfer
The work gave Heineken Beverages its first portfolio-wide way to compare acquisition effort against usable output, diagnose inefficiency, and turn campaign learnings into repeatable acquisition guidance.
The DMI didn't stay within this engagement. It became the dashboard logic for Heineken Beverages South Africa — and, as far as I know, is still being used today.
The work helped shift the Centre of Intelligence from a reporting function into a strategic advisory partner — and turned first-party data from a fragmented marketing activity into a measurable, behaviour-led growth system.
©2026 All Rights Reserved.
kimhutton.
+159%
month-on-monthFPD uplift
26
brands analysed
66
criteria data maturity index
Data maturity isn't what you collect. It's what it's worth.
Client: Heineken BeveragesRole: Senior Digital Insights Manager, Centre of IntelligenceScope: 26-brand portfolio · South AfricaFocus: First-party data · CRM · lead generation · UX optimisation · measurement frameworks · portfolio-wide brand recommendations
Setting the scene
The brief asked for a phased first-party data maturity approach across a 26-brand portfolio.
I was embedded within Heineken Beverages as Senior Insights Manager at Ripple — a Center of Intelligence built inside the client organisation by Hoorah Group.
It wasn't a traditional agency relationship. I had direct access to brand data and dashboards — the data intimacy of an insider, and the diagnostic independence of an external consultant.
The Observation
As I worked through the data and analysed past FPD collection campaigns from all the brands, I realised that all of the brands were effectively buying the software suite and using one feature — yet they were all mandated to allocate some of their marketing budget to FPD collection and maturity.
Strategic Reframe
FROM How do we collect more data?
To
Do the brands know how to make the data worth collecting, worth giving, and worth using afterwards?
Approach
Key insights
Three sequential phases — each the necessary precondition for the next.PHASE ONE: A shared maturity roadmap. Aim: establish a shared definition of what maturity looks like and answer the initial brief.
Data was being collected, but not consistently cleaned, enriched, tracked against effort, or evaluated against the final outcome that mattered: full, usable, contactable consumer profiles.
The DiagnosticThe real problem was not insufficient collection activity. It was insufficient diagnostic infrastructure to evaluate what that activity was producing.
WORKSHOP ONE:The Shared Maturity Roadmap addressed the initial brief directly. It gave brand teams what they needed to understand: what first-party data maturity actually meant — what consumer barriers existed at each stage, what tools were available, what data could be collected, and how each stage of maturity could shape better strategy downstream.
But in developing it, a second gap became impossible to ignore. Brand teams now had a roadmap — but no instrument to tell them where they currently sat on it.
That gap opened the door to Phase Two. The brief was expanded, and my work began.
PHASE TWO: The Data Maturity IndexAim: Build the measurement instrument.
Context
I knew from the first phase of this approach that just about every brand was going to be scrutinised for disproportionate spend vs return. I had built direct relationships with senior marketing leadership and brand managers — and as some of the most loved brands in SA, the egos were high. Certain teams were getting a bit defensive. So, I had to ensure that the framework was entirely objective, factual and based on the metrics we had.
When I went to pull the data, First Party Data activity wasn't being tracked within one system.
It was clear that brands were collecting data, spending budget, running mechanics and reporting numbers — but there was no shared way to see whether any of it was actually creating usable commercial value. It became clear that many brands could not confidently answer the question underneath all of it:
"How much effort are we putting in, and what usable value are we getting back?"That was the strategic unlock.
Building the Data Maturity Index
I developed a survey for teams to circulate and fill in the numbers and yes/no answers. The questions, their yes/no answers and provided metrics were all weighted according to the Data Maturity Index, giving each brand a 'Data Maturity Score'.
The structural logic: 66 criteria connecting the full acquisition journey — campaign mechanics, paid media, social CTAs, form design, consent clarity, behavioural-data questions, CRM usefulness, and future marketing value.
The weighting logic: the greater the complexity and strategic knowledge required by a tactic, the greater the score it contributes.
How this answers Heineken’s initial brief: if it rewards activity, brands will generate activity. If it rewards sophistication, brands will invest in capability. A principle about incentive design embedded in a measurement tool. This wasn't about measuring what was easy to count — it was one that measures what matters commercially.
What The Results Revealed
Once I had the DMI scores and unique profiles for each brand, I developed a combination graph to showcase DMI score (effort) and unique profiles (result), to visualise the inefficiency gap. I knew that the data needed a specific lens to become legible. This graph made the gap between what a brand is investing and what it is getting back immediately, indefensibly visible.
AMARULA67,900DMI Score: 61
3.88% budget attribution · High output. Low proportional investment.
SAVANNA7,100DMI Score: 59.5
20.91% budget attribution · Five times the investment. One-ninth of the output.
Savanna had the largest budget allocation toward FPD collection, and one of the highest DMI scores in the portfolio. However, the amount of usable, unique profiles they had compared to their DMI and budget allocation were dismal. I was not saying their campaigns performed poorly — I was saying they had a structural misallocation between investment and return.
Amarula, on the other hand, only had a 3.88% budget allocation to FPD and had not done any advanced FPD collection campaigns such as gamification. Yet they produced 67,900 unique, usable profiles — the highest in the portfolio, at less than a fifth of Savanna's proportional budget investment.
So, Savanna was putting in five times the proportional investment into First Party Data acquisition as Amarula, and getting roughly one-ninth of the profile output.
The individual roadmaps
From each brand's diagnostic position, I developed prescriptive, bounded, operationally credible recommendations and individual strategic roadmaps — specific, prioritised initiative sets showing which FPD tactics to implement next and what maturity score improvement each would drive. I wasn't asking brands to transform their strategy. I was showing them what was achievable within the resources they already had.
Brands with very simple data acquisition tactics were given initiatives they could still comfortably execute, and as they progressed, the sophistication became more complex — so that teams didn't feel overwhelmed or out of their depth. Essentially, brand-to-brand consultation on where they were in their data maturity journey, what they were doing wrong, how to fix it, and what to do next.
Solving this within existing 1PD budgets
These were some of the most loved brands in South Africa. Online engagement was high. But first-party data numbers were dismal.
Users would relentlessly engage with UGC, then drop off or fail to complete profile submissions in the same campaign window.
Perhaps it was because I was studying UX at the time, but I knew that during my audit phase of this work I realised that marketing teams had no idea how to design for effective FPD acquisition touchpoints. Forms were losing completions. Off-platform redirects were creating drop-off at the critical conversion moment.It was a value-exchange problem — one that could be solved within existing FPD budgets.
The solution was not more collection activity. It was designing for reciprocity: determining what the value exchange actually is for each brand and their consumers, ensuring data collection gets adequate return on mandated spend without doing more or spending more. But the teams didn't know how to get there, nor how to design for it.
The question was not how to collect more data. It was how to design collection so that consumers wanted to give it.
PHASE THREE: Post-Campaign Analysis Reports Aim: provide evidence that closed the loop on the diagnostic claims made in Phase 2.
The analysis was designed to validate the guide, not just report on the campaigns. I was testing the hypothesis that specific architectural decisions — native form over redirect, targeting discipline, consent integration — drive commercially significant differences in FPD acquisition performance. My hypothesis was correct.
The three campaigns — Amarula, Bains, Klipdrift — together tested the variables the framework had identified as commercially significant:
Native vs off-platform acquisition (Bains vs Klipdrift)
The impact of targeting discipline (Amarula)
What happens when UX principles are ignored (Klipdrift)
The Analytical Framework
Each dimension was chosen because it corresponded to a variable that the UX guide had identified as commercially significant.
I designed a single analytical framework — four standardised dimensions: approach, form, posts, media — and applied it consistently across all three campaigns. By having this single framework, I could read the results side by side, isolate the variables that differ between campaigns, and attribute performance differentials to specific decisions rather than brand-level factors like size or budget.
What the Analysis Proved
Klipdrift isolates exactly what happens when the principles the UX guide recommended are ignored. Compare this directly to Bains:
KLIPDRIFT1,928CPL R34.59
Total Spend: R66,694· No targeting strategy · off-platform redirect · unclear prize structure · high barrier to entry, unnecessary entry effort
BAINS21,543R3.92 CPL
Total spend: R91,999· Native Facebook instant form · granular psychographic targeting · four-stage data collection with consent integrated into the flow
If it had achieved Bains-level CPL efficiency (R3.92), that same budget would have generated approximately 17,014 leads — nearly nine times what it actually produced.
My strategic hypothesis from phase 1 was confirmed: better UX produced better data, not just more data.
Why Provenance Matters
All findings were derived from the portfolio's own data — the specific performance of specific campaigns run by brands in this portfolio with their audiences. Giving us rich, useful information on each brand’s audiences. Such as — what causes Amarula consumers to complete a form, what causes Klipdrift audiences to drop off, what made Bains achieve R3.92 CPL against Klipdrift's R34.59 — these are proprietary. And it directly informs the marketing and brand teams of what is working, and what is not, for their audience.
The value of integrating FPD tracking into campaigns
Amarula’s A/B test: one creative variant generated 1,855 leads; the other, 17,207. An 828% differential from a single variable change.
A specific finding about what motivates Amarula's audience when presented with a specific mechanic, at a specific moment, in a specific media context. Commercially durable in a way that general guidance never is — and generated at the cost of media spend already allocated to the programme.
Targeting
Granular psychographic targeting and lookalike audiences (based on this granular detail) was a recommendation in phase 2. Amarula and Bains both used this recommendation to varying degrees. Klipdrift used no targeting strategy.
Results
159% month-on-month uplift in first-party data capture across the portfolio — without extending spend.
Against a target of 200 leads at R15 CPL, the Amarula campaign I analysed and informed delivered 19,062 leads at R1.57 CPL — a 9,431% over-performance on volume. The strategic decisions that drove that result are a direct result of the frameworks and recommendations I built.
The A/B test I'd recommended produced an 828% difference between variants — proof that the methodology generates proprietary intelligence about what motivates a specific audience, not just a better-performing ad.
Unlocked a quarter of a million rand in expanded scope from the original brief within one week by earning the trust and buy-in from all brands within the portfolio.
Capability transfer
The work gave Heineken Beverages its first portfolio-wide way to compare acquisition effort against usable output, diagnose inefficiency, and turn campaign learnings into repeatable acquisition guidance.
The DMI didn't stay within this engagement. It became the dashboard logic for Heineken Beverages South Africa — and, as far as I know, is still being used today.
The work helped shift the Centre of Intelligence from a reporting function into a strategic advisory partner — and turned first-party data from a fragmented marketing activity into a measurable, behaviour-led growth system.
©2026 All Rights Reserved.